A&E triage, from prompt to tested change in minutes.
A plain-English brief becomes a working emergency-department model: arrivals, triage, queues, doctors, and exits.
Then simmodlr runs it, analyses the results, recommends a doctor-capacity change, and tests it before anything is saved.
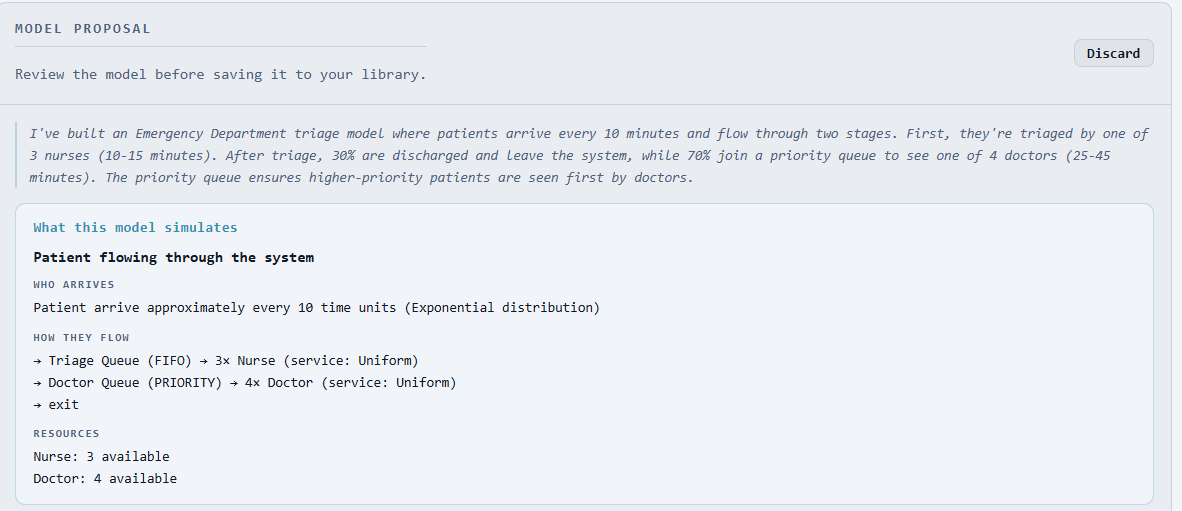
Review the proposed flow before saving it to the model library.
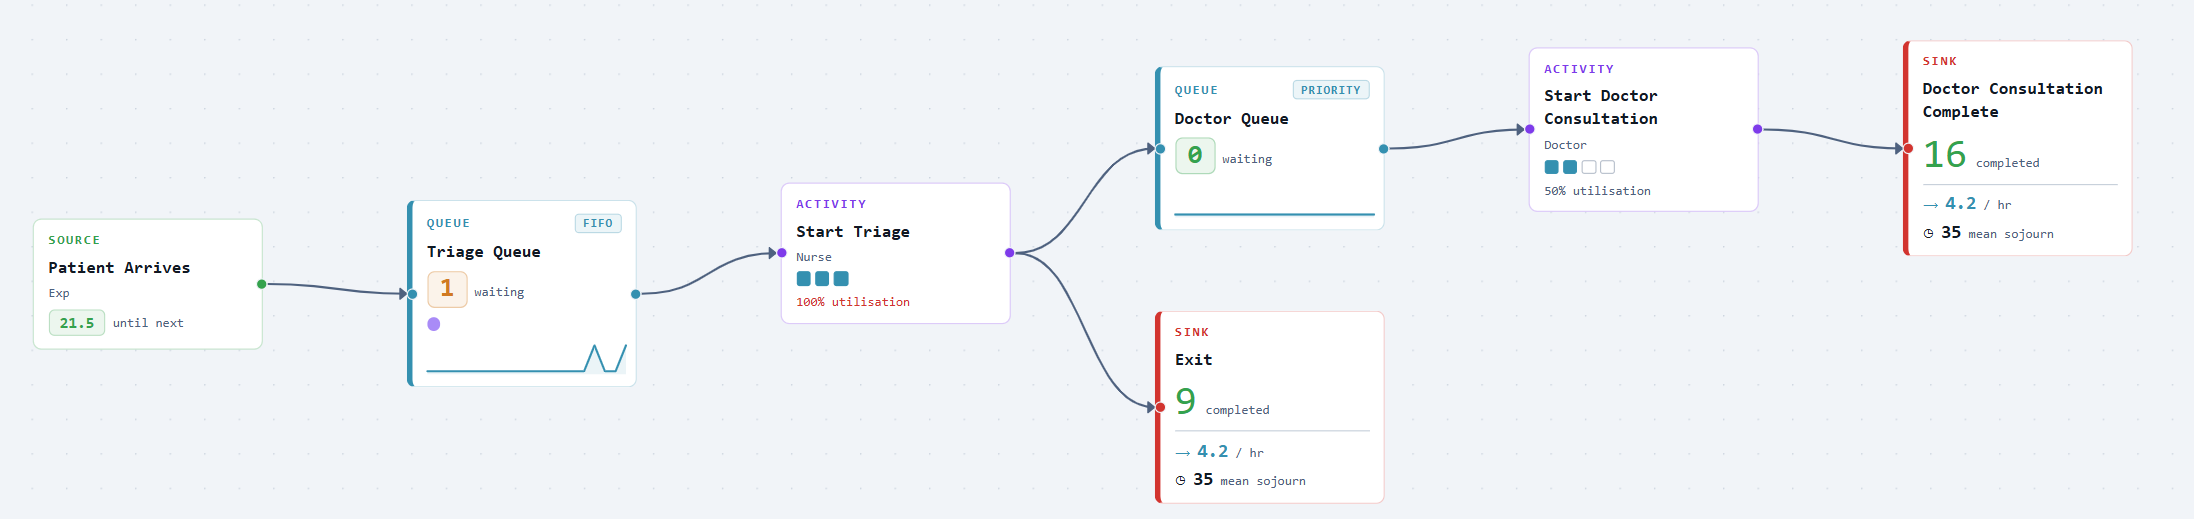
Seeing the model run makes the process visible: queues, movement, resource use, and flow. simmodlr lets you run experiments by changing model parameters and testing values over ranges — so you can understand behaviour, not just observe it.
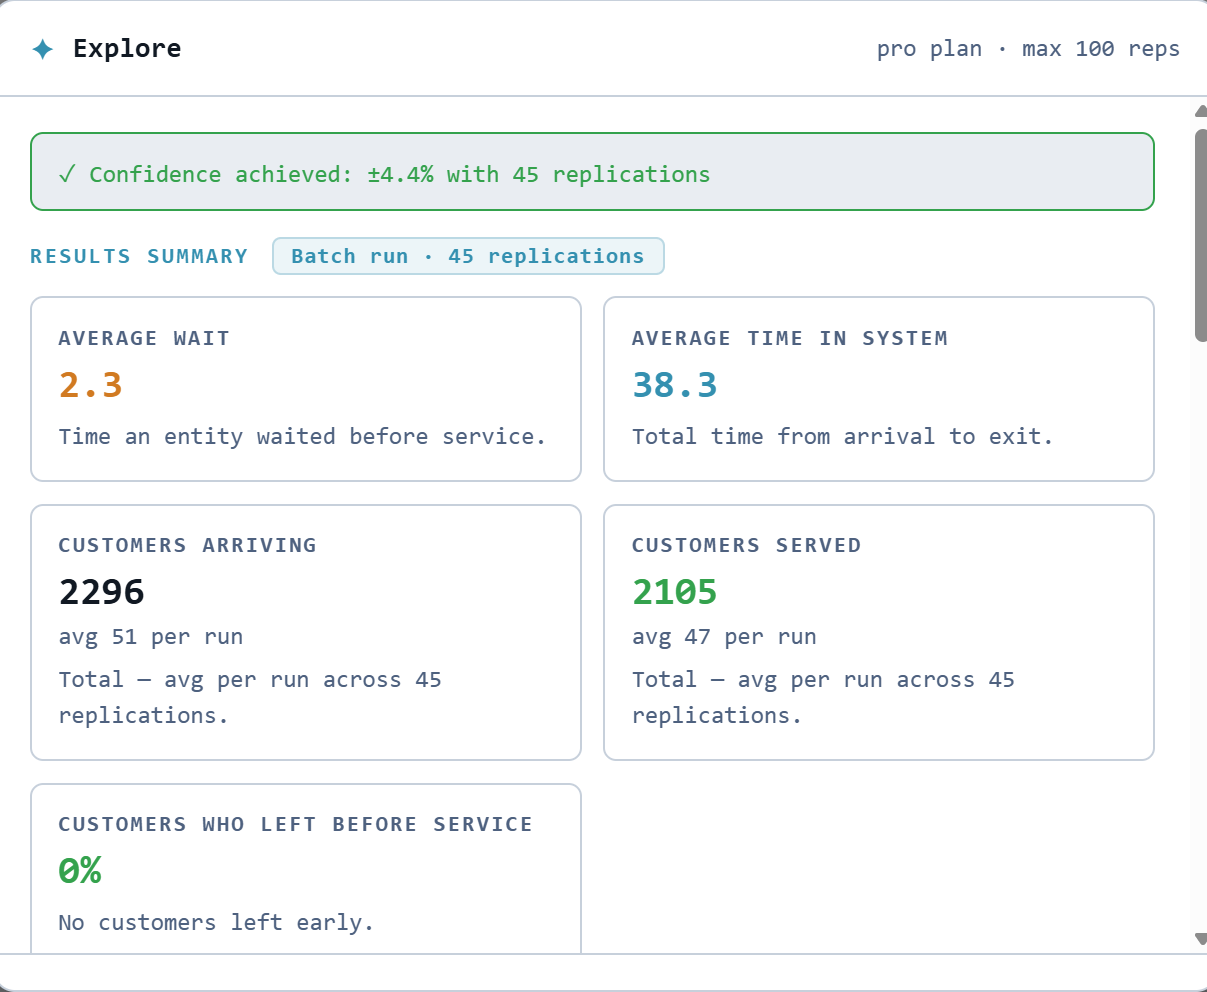
Explore builds confidence, summarises the results, and recommends what to change next.
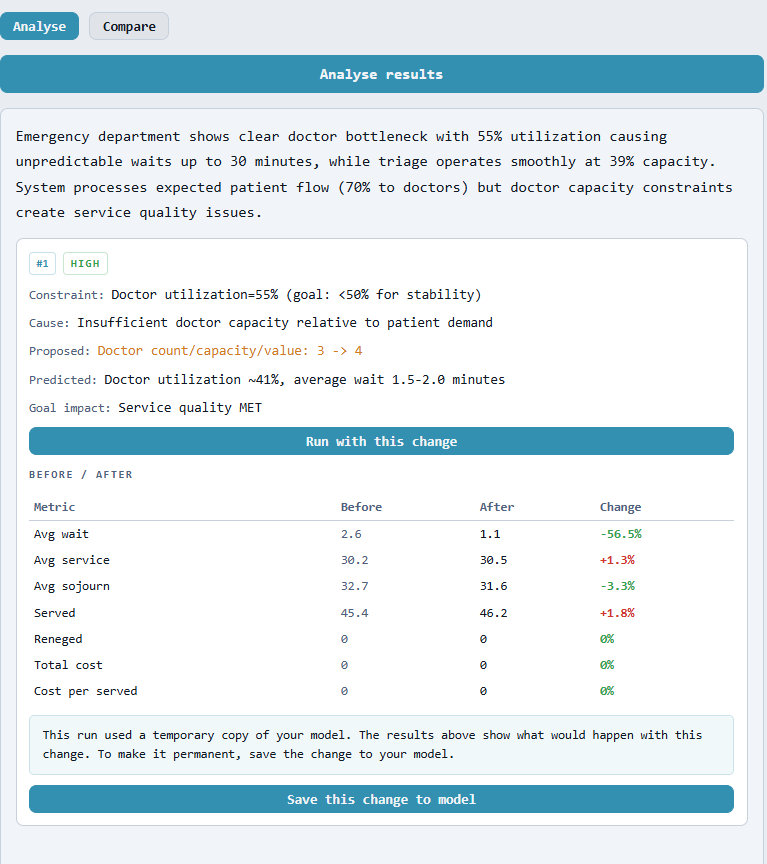
Test the recommendation, compare the result, and save it when it works.
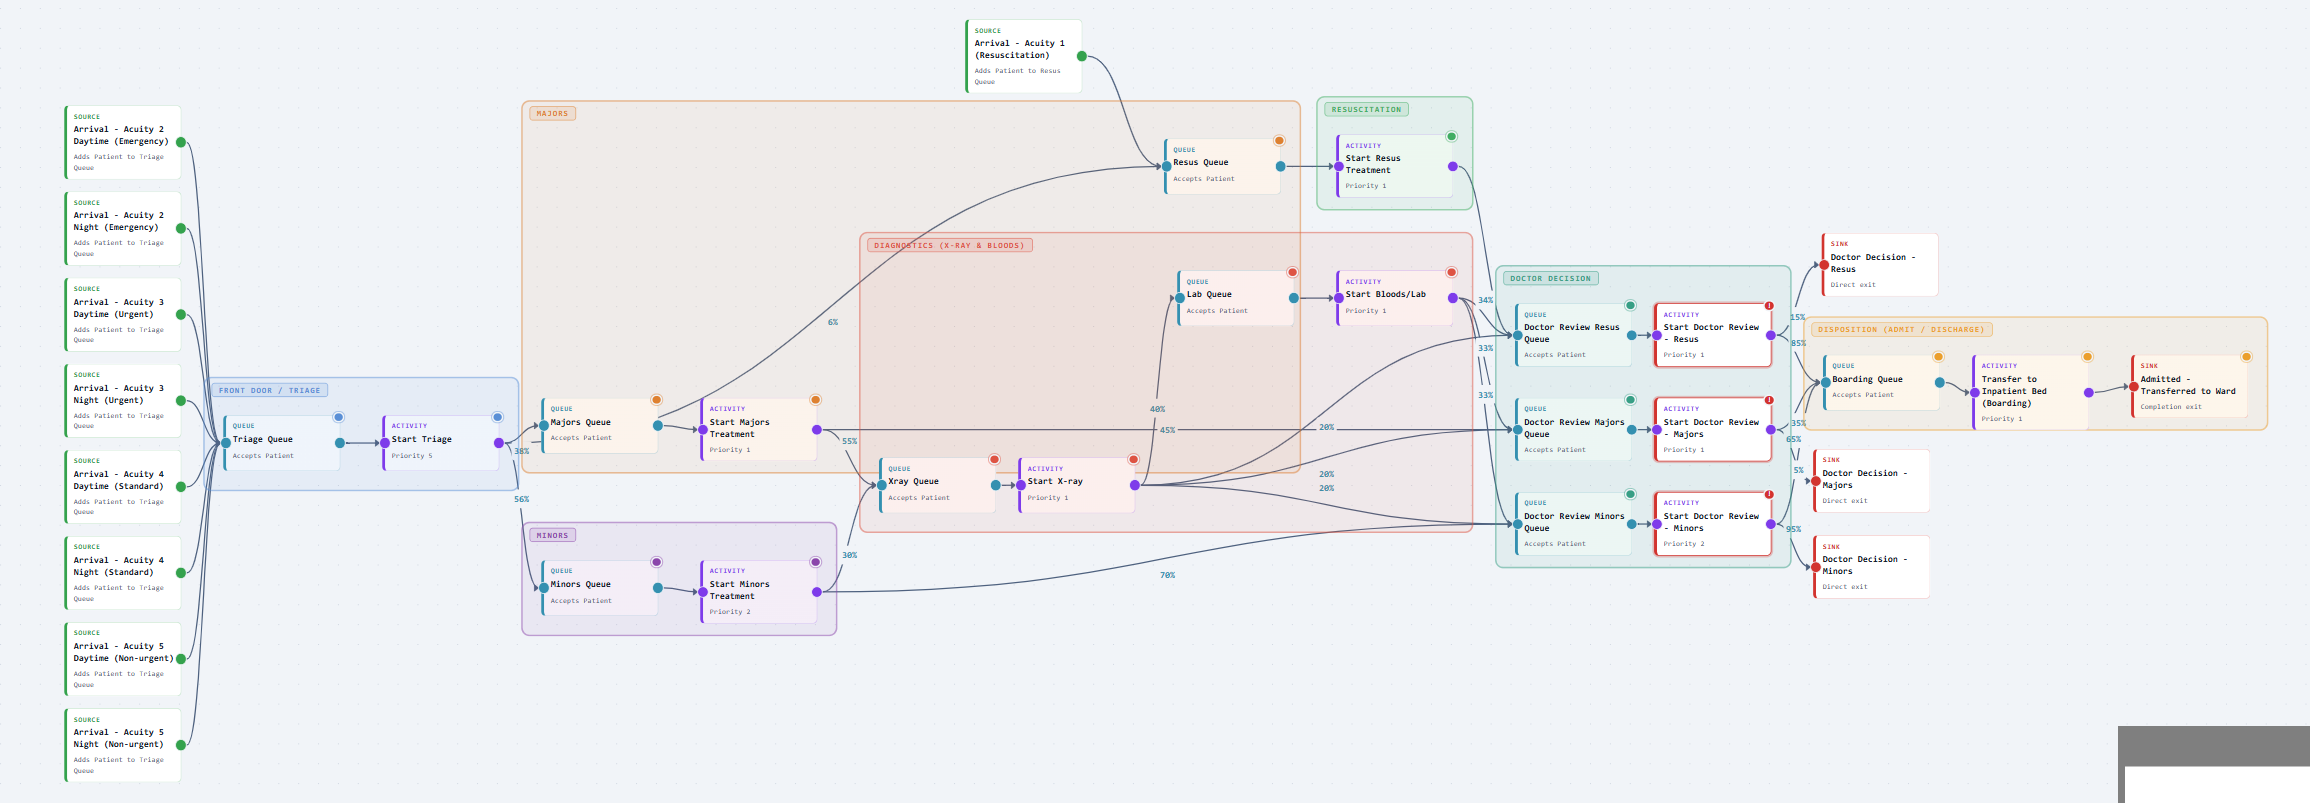
The triage example is easy to follow, but the same canvas can hold larger pathways too. Sections help organise complex models with branching routes, shared resources, priorities, and handoffs across a whole service.